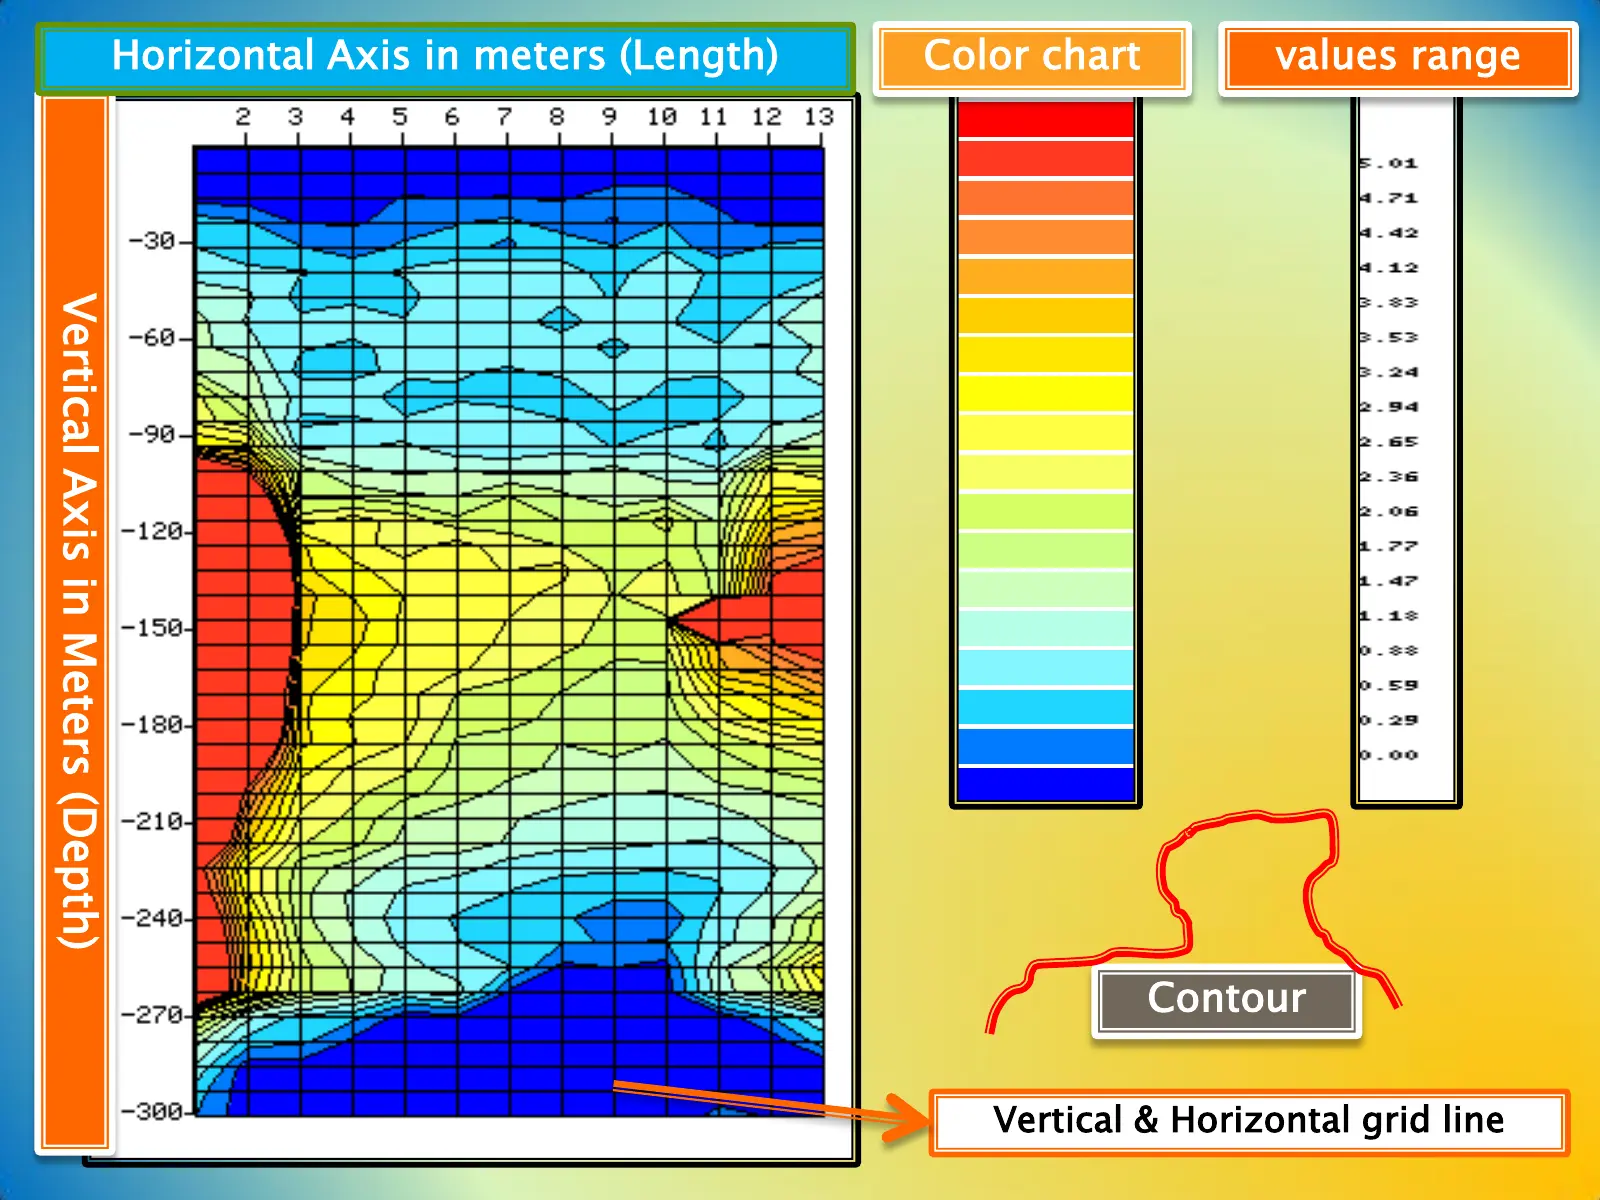
For the training configuration shown in the supplied documents, keep the M and N electrodes 10 m apart and move both electrodes by the same interval after every reading. Use a line test before measurement, keep spacing and gain consistent, screen a broad area before running a detailed profile, and compare repeat or cross-lines. Read the curve first for coherent V- or W-shaped changes, then check whether the profile map shows a continuous, geologically plausible anomaly. Blue is a low-value zone on that map, not automatic proof of groundwater; clay, soft mud, salinity, minerals and interference can produce similar responses. Drilling logs and pumping tests remain the final verification.
A PQWT groundwater detector can display field measurements as multi-line curves and colored geological profile maps. These outputs help an operator compare changes from one station to the next, but the screen does not photograph an aquifer and it does not directly measure well yield.
This guide reorganizes two supplied training documents - Water Detector Operation & Analysis and Analysis of Profile Map - into a practical field workflow. It explains the diagrams and example images while adding the quality-control checks needed for responsible borehole siting.
What a PQWT curve and geological profile map display
The instrument records an electrical response at a sequence of field stations. Software organizes those values in two complementary views. The curve view makes point-to-point rises, falls, convergence and separation easier to see. The profile map places the measurements on a distance-versus-depth grid and uses contours plus a color legend to show relative differences.
Interpretation begins with the measured pattern, not with a color name. A useful anomaly has a coherent shape, repeats under the same settings and fits a reasonable geological model. An isolated extreme value is more likely to require remeasurement than immediate drilling.
| Output | Horizontal axis | Vertical axis | Best use | Main caution |
|---|---|---|---|---|
| Curve graph | Measurement point or station number | Measured response or potential-difference value | Identify baselines, lows, highs, convergence and repeatable V/W patterns | One sharp fall can be contact error, interference or a local non-water conductor |
| Profile map | Measurement point, distance or survey-line length | Interpreted depth for the selected configuration | Compare the shape, continuity and depth extent of relative-value zones | Depth and color meaning depend on model settings, acquisition quality and local geology |
| Contour and grid | Station spacing | Depth interval | Estimate the geometry and continuity of a mapped contrast | A contour outlines equal or similar values; it is not a rock boundary confirmed by drilling |
M and N electrode setup: keep geometry consistent
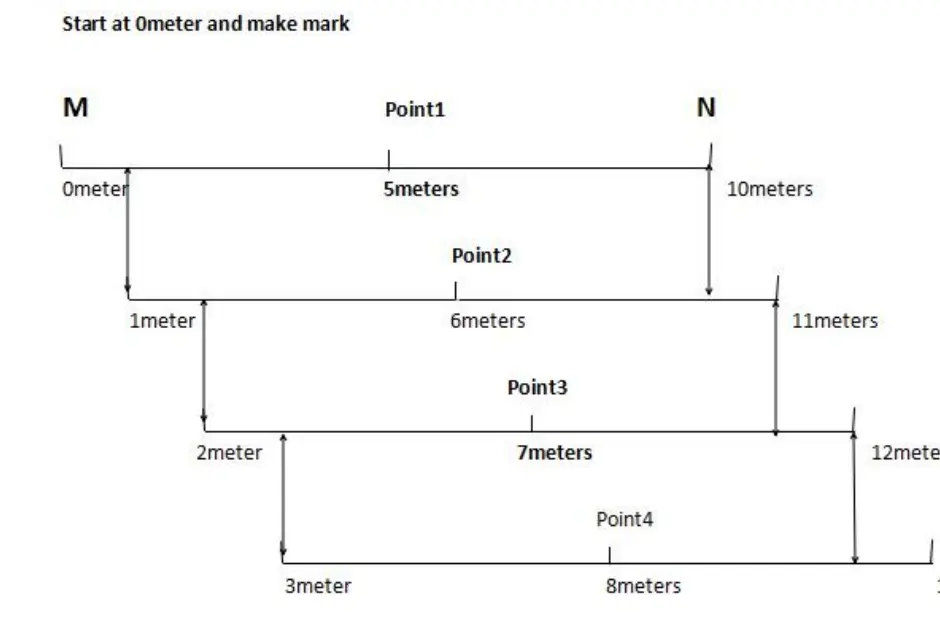
The operation guide illustrates a 10 m M-N electrode separation. Point 1 is recorded with M at the 0 m mark and N at 10 m; the plotted station is the midpoint at 5 m. Both electrodes then move forward together by the selected station interval while their separation remains constant.
With a 1 m movement interval, Point 2 is centered at 6 m, Point 3 at 7 m and Point 4 at 8 m. In this layout, the ground coordinate is the point number plus 4 m when the tape origin is 0 m. If a different movement interval is used, recalculate the midpoint and keep the geometry unchanged for the entire line.
Mark the line
Use a tape, identify the 0 m origin and number every station before collecting data.
Install both electrodes
Place M and N firmly in the soil with the configured separation and avoid underground metal.
Run Line Test
Hold the line-test control for about 2-3 seconds. A normal indicator confirms the cable and contact path; repair a fault before measuring.
Record one point
Wait for a stable reading, save it with the correct station number and note unusual field conditions.
Move M and N together
Advance both electrodes by the same station interval without changing their separation or line direction.
Single frequency, three-frequency screening and profile survey
The training material separates rapid reconnaissance from detailed profile measurement. Use the fast mode to reduce a large area to a smaller zone, then collect a complete profile with consistent station geometry before ranking a drilling target.
| Mode | Purpose | How to use it | Interpretation limit |
|---|---|---|---|
| Single frequency | Quick screening at one selected level | Choose the model's depth or frequency option and run a short line to locate broad changes | A selected level is not an independently verified exact depth |
| Three frequency | General screening across shallow, middle and deeper responses | Compare the three curves and mark coherent high/low changes or intersections for follow-up | The supplied legacy guide lists 170 Hz, 67 Hz and 25 Hz for one configuration; confirm the frequencies on the current model |
| Profile survey | Detailed measurement for geological comparison and borehole-target ranking | Collect a complete line with fixed spacing, gain and electrode geometry, then generate the curve and profile map | A detailed map still requires repeat lines, geology and drilling verification |
Design survey lines that can be checked and repeated
The supplied operation guide recommends enough stations to show a complete geological trend rather than only one isolated anomaly. It describes 15-30 points per line and three parallel lines that begin from the same reference, with approximately 1 m between neighboring lines. Treat those numbers as a training layout, then adjust the survey design to the model, site size, target geometry and local geology.
A cross-line is often more informative than adding many points in the same direction. If the feature is a fracture, fault or lithological contact, a perpendicular line can test its direction and continuity. A true geological contrast should be more repeatable than a bad electrode contact or local electrical noise.
- Keep station spacing, electrode separation, line direction and gain unchanged within one line.
- Use Gain 0 for normal signals; increase gain only when the reading remains zero or too weak, and then keep the new gain for the full comparison line.
- Avoid high-voltage lines, transmission or signal towers, railways, busy roads, fences, buried pipes and other conductive metal where possible.
- Record dry soil, recent rain, standing water, fill material, steep slopes and any change in electrode contact.
- Repeat questionable stations before moving the line and save both the curve and original profile map.
- Photograph representative surface rock and collect nearby well depths, water strikes and dry-hole records.
How to read a groundwater detector curve graph
Start by identifying the normal background trend across the line. Then look for a group of curves that fall or rise together, converge, intersect or change slope over adjacent points. The training guide uses letters such as V, W, L and A to describe recognizable shapes, but the letter itself is not a geological diagnosis.
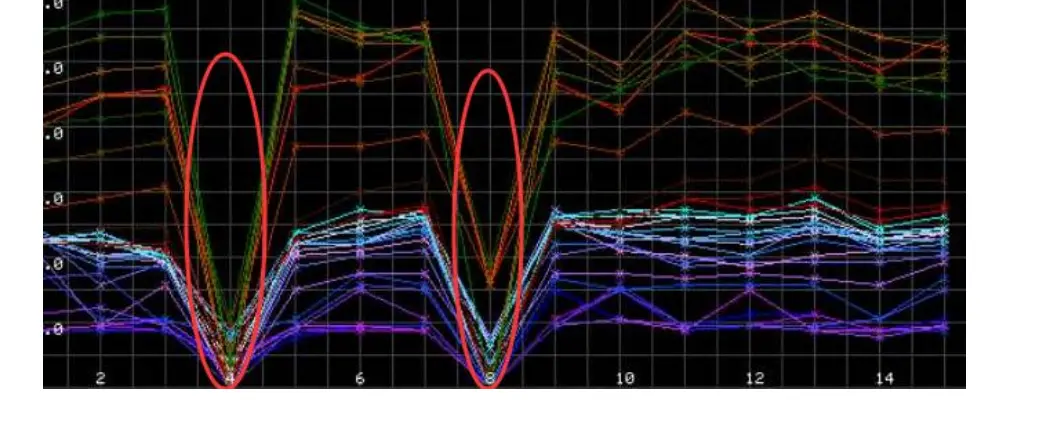
The example below highlights two strong V-shaped low-value zones around Points 4 and 8. They deserve comparison with the profile map because multiple curves fall in a similar station range. Before treating either as a target, repeat the point, check contact quality and confirm that the pattern appears on neighboring or crossing lines.
Shape
Does the change extend over adjacent stations, or is it only one abrupt point?
Agreement
Do several curves change together, or does only one line behave differently?
Repeatability
Does remeasurement and a nearby line reproduce the same station range?
Geology
Could a fracture, weathered contact, clay zone, mineralization or cultural interference explain the response?
How to read the geological profile map
Read the axes and legend before interpreting the image. The horizontal axis follows the station numbers or survey-line distance. The vertical axis shows the model's interpreted depth scale. Grid lines organize distance and depth, contours join similar values, and the color bar converts the measured range into a visual gradient.
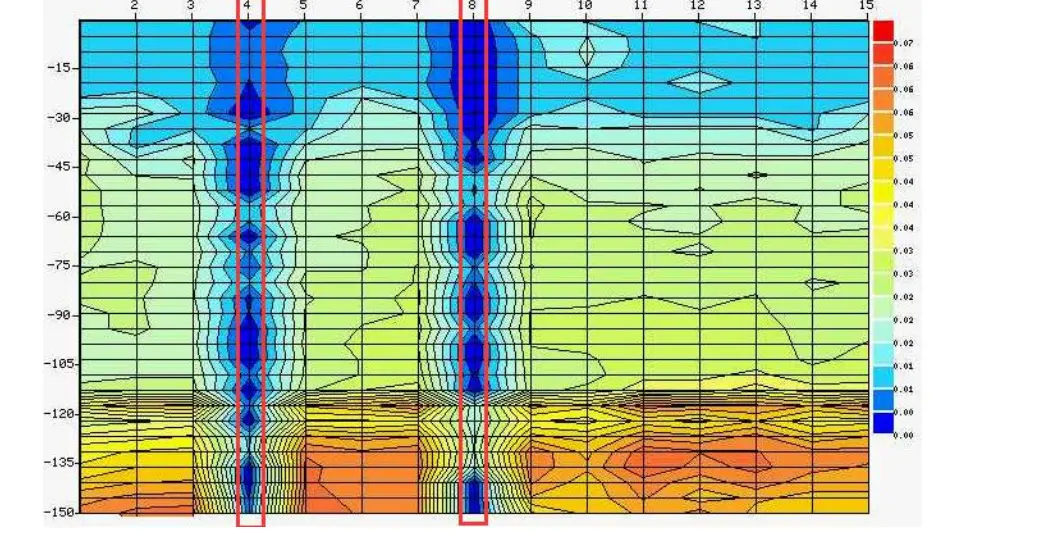
In the supplied example, the low-value columns at Points 4 and 8 continue downward through several interpreted depth intervals. Their continuity is more useful than a small isolated patch. The operator would compare their geometry with the curve lows, repeat lines, surface geology and any known fracture direction before deciding whether either point is a reasonable drilling candidate.
What blue, yellow and red mean on a PQWT profile
The color scale is relative to the value range shown beside that map. The supplied documents generally display lower values in blue and higher values in red, with cyan, green, yellow and orange between them. This makes contrast easy to see, but colors do not have one universal geological meaning.
| Displayed color | Relative value in the supplied examples | Possible interpretations | What to check |
|---|---|---|---|
| Dark blue / light blue | Lower measured values | Water-bearing fracture, wet or soft material, clay, soft mud, salinity, conductive mineral or metal | Continuity, shape, cross-line repeatability, geology and nearby well evidence |
| Green / yellow | Intermediate values | Weathered or moderately resistive material, transition between units, mixed lithology | Whether the zone forms a boundary, layer or gradational contact |
| Orange / red | Higher measured values | Hard or dry resistive rock, cavity or another high-contrast body | Geometry, surface rock, known karst conditions and alternative explanations |
Combine the curve and profile before selecting a borehole target
The two supplied images are intended to be read together. Points 4 and 8 show pronounced curve lows and matching vertical low-value zones on the profile. The training document describes them as possible fracture-related targets and reports a separate case in which drilling at Point 8 encountered water at about 60 m, with a final depth of 150 m and a reported yield of 24 m³/h.
That reported outcome is a manufacturer training example, not an independently verified success rate and not a guarantee for another site. The same color or curve shape can have a different cause in alluvium, clay, granite, volcanic rock, limestone or mineralized ground.
- Do not select a drilling point from one color patch without checking the legend.
- Do not change gain, point spacing or electrode geometry midway and compare the results as one line.
- Do not assume the deepest displayed blue zone is automatically the best or most economical target.
- Do not quote a flow rate before drilling and conducting a controlled pumping test.
- Do not hide uncertainty: document interference, missing data and other plausible interpretations.
Reject bad measurements
Repeat zero, unstable, isolated or contact-sensitive values before interpreting the line.
Match curve and profile
Check whether the station range, shape and relative strength agree in both views.
Test another line
Use a parallel line and preferably a cross-line to evaluate continuity and direction.
Build a geological explanation
Integrate surface rock, terrain, structures, nearby wells and possible interference.
Rank alternatives
Compare at least two candidate points and explain why one has a stronger hydrogeological case.
Verify in the borehole
Record the drilling log, water strikes, static level, pumping rate, drawdown, recovery and water quality.
Download the complete PQWT operation and profile-analysis files
The website article summarizes the most useful field points, while the complete training files contain additional diagrams, curve examples, profile-map comparisons and operating notes. The files below are hosted on pqwtofficial.com and can be downloaded directly without a form.
These are general training references, not a replacement for the operating manual of every PQWT model. For help with an existing device, use after-sales support and include the model, purchase channel, survey layout, raw readings and the full map legend. For a new purchase, compare the equipment below and request a configuration for your intended project.
Water Detector Operation & Analysis
M/N electrode layout, line test, measurement modes, gain control, curve reading and a worked survey example.
6 pages · 573 KBDownload PDF ↓EnglishPQWT Profile Map Analysis
Profile axes, contours, color/value ranges, curve patterns and illustrated geological examples.
77 pages · 5.4 MBDownload PDF ↓FrançaisAnalyse de la Carte de Profil PQWT
Version française du guide complet d’interprétation des cartes de profil et des courbes.
76 pages · 7.3 MBDownload PDF ↓РусскийЭксплуатация и Анализ Детектора Воды
Русская версия руководства по настройке, измерениям, кривым и профилям.
8 pages · 312 KBDownload PDF ↓Related PQWT groundwater detector configurations
Choose the detector range and acquisition workflow from the expected geology, realistic drilling depth and project scale. Confirm the current manual, firmware, electrode layout and included accessories with the formal quotation.
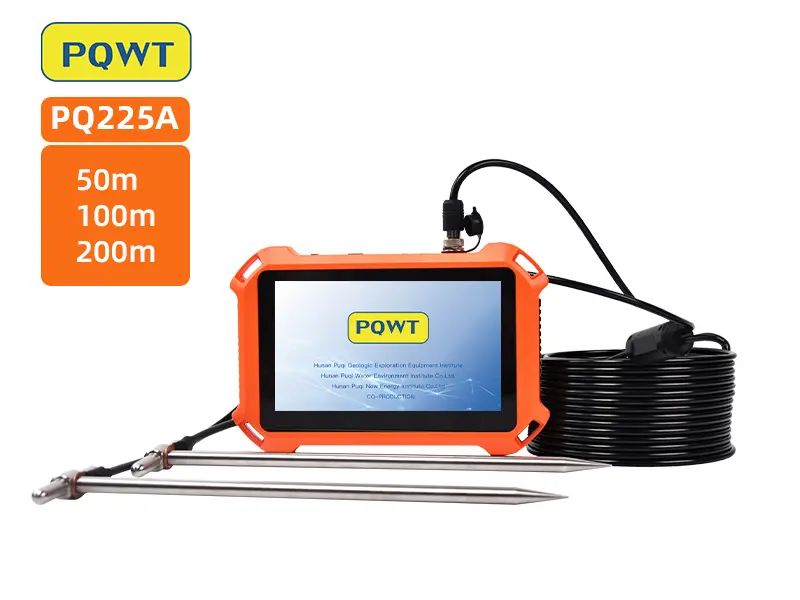
50 / 100 / 200 m stated survey settings
Review the portable profile-mapping workflow, model-specific setup and project quotation requirements.
View product →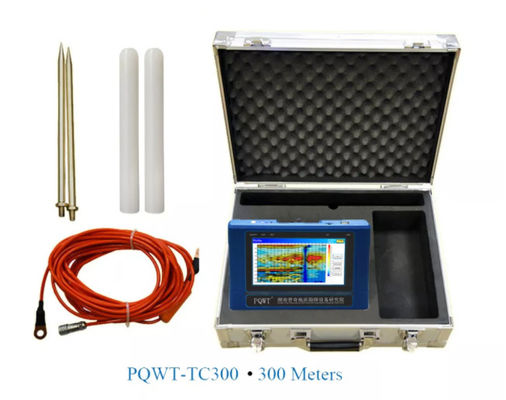
Portable 300 m profile mapping
A portable groundwater-survey configuration with automatic curves and profile-map output for planned field lines.
View product →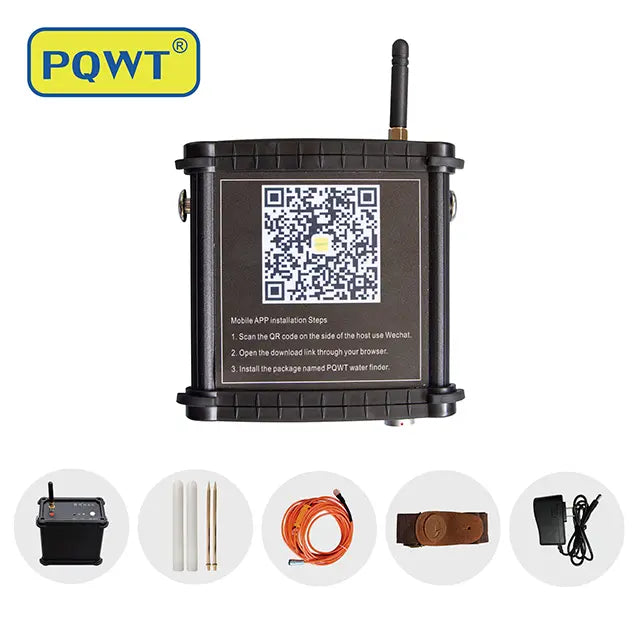
Mobile 400 m field workflow
An Android phone or tablet workflow for curve and profile comparison; the app is not compatible with iPhone or iPad.
View product →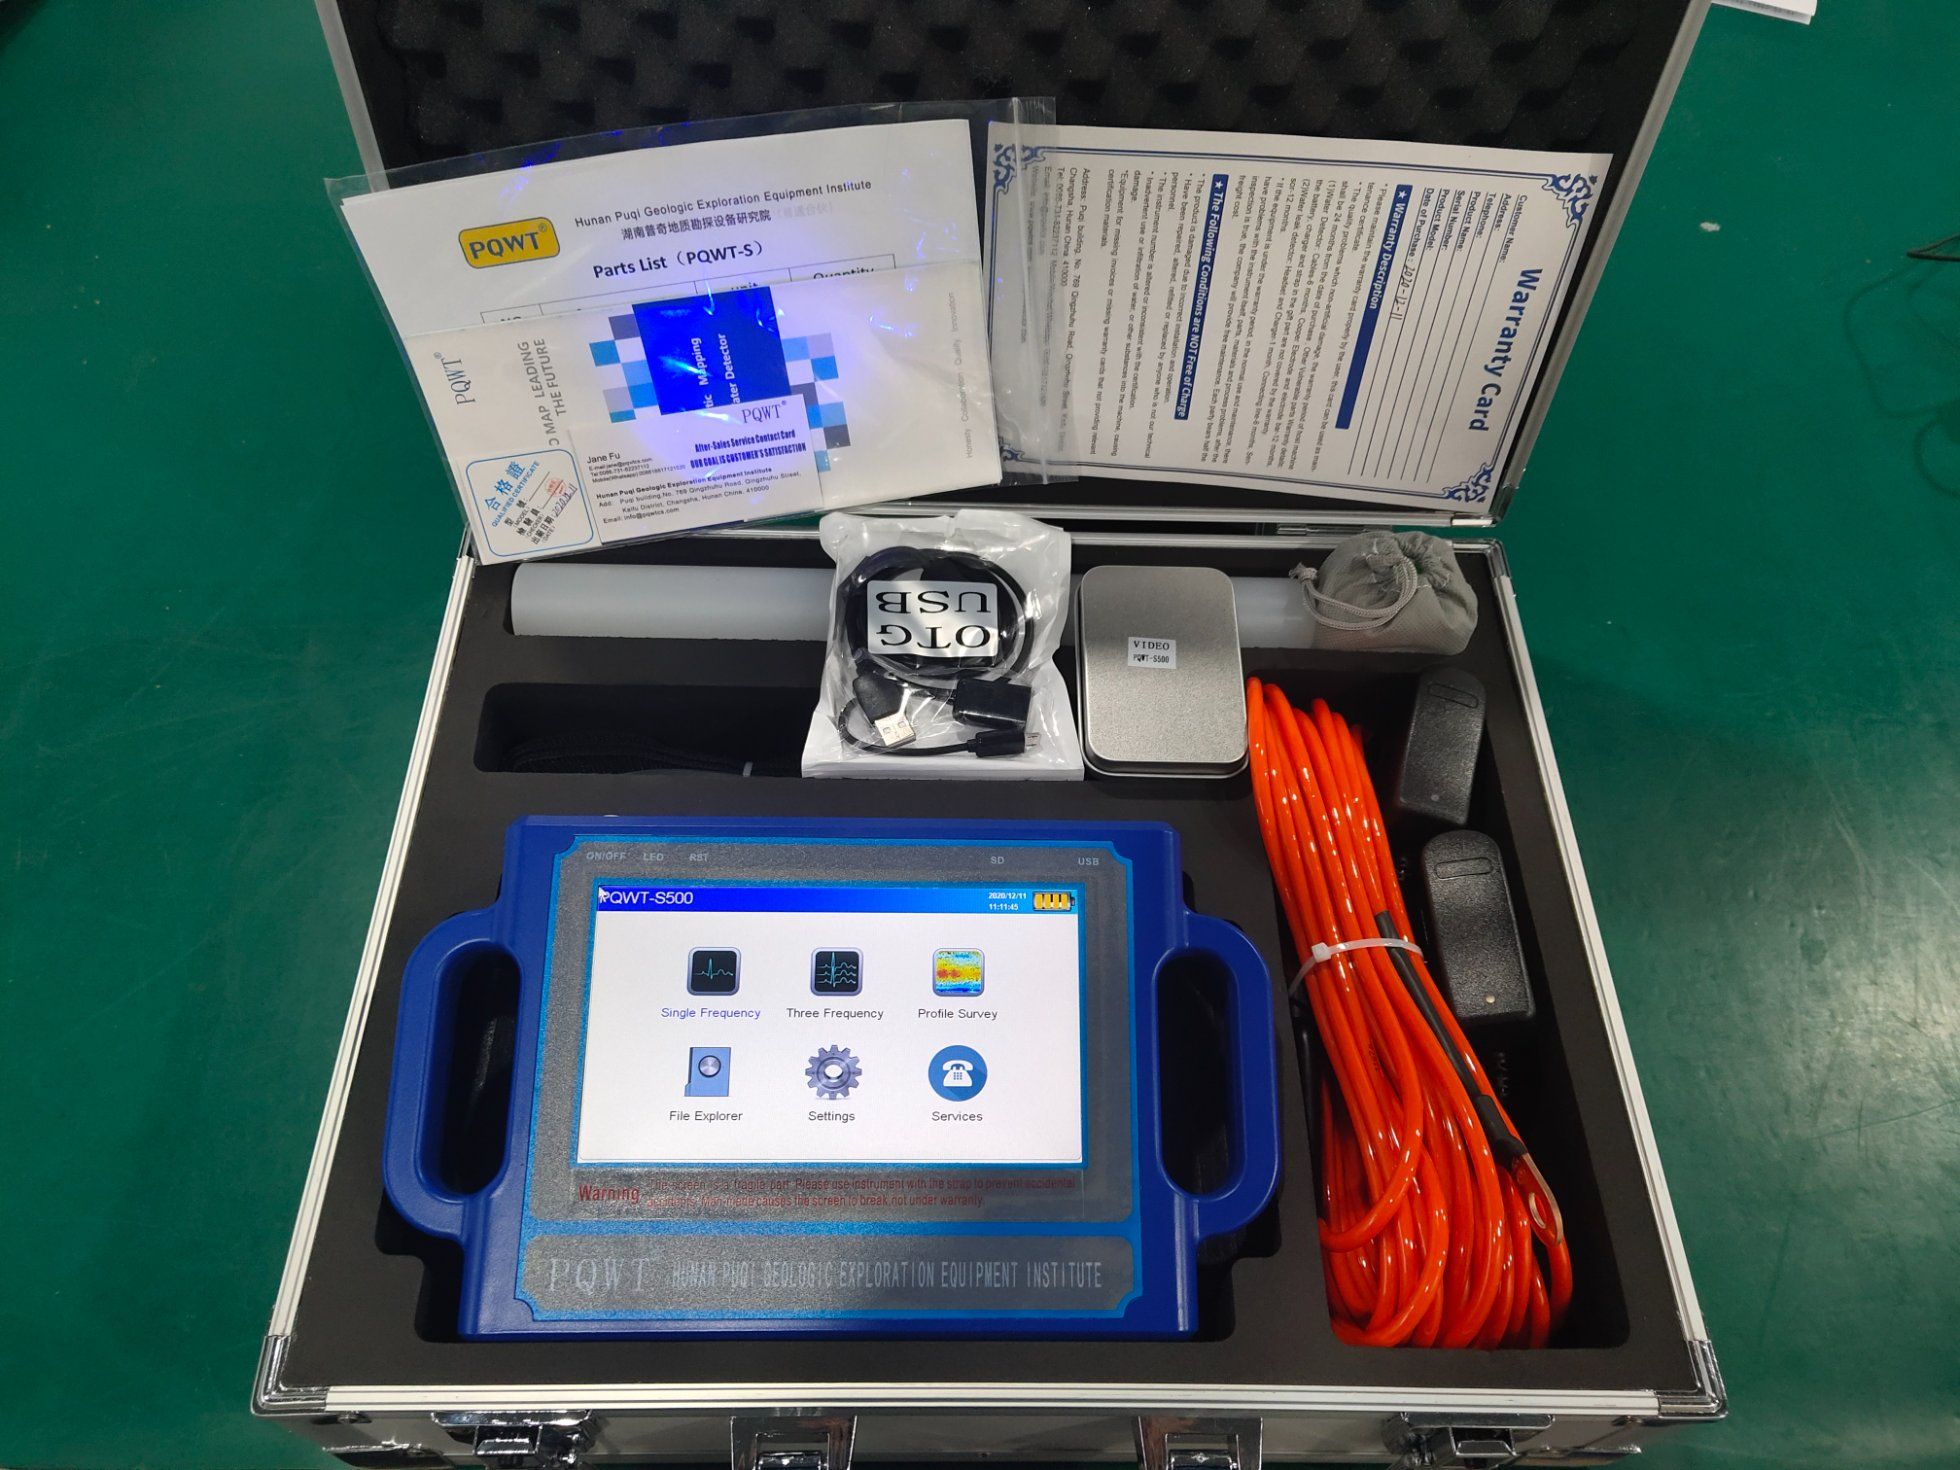
Portable 500 m survey range
For projects whose expected geology and drilling plan justify a deeper stated investigation range.
View product →Frequently asked questions
How far apart should the M and N electrodes be?+
The supplied training example uses a constant 10 m M-N separation, with both electrodes moving 1 m after each reading. Confirm the correct geometry in the manual for your exact model and keep it unchanged for the full comparison line.
How many points should a PQWT profile line contain?+
The supplied operation guide recommends at least 15 and no more than 30 points for its example workflow. Actual line length and spacing should follow the model, target size, geology and available survey area.
Does a blue zone on the profile map mean groundwater?+
No. Blue represents lower values on the displayed legend. Water-bearing fractures may be conductive, but clay, soft mud, salinity, minerals and buried metal can create similar low values.
What do V- and W-shaped curves mean?+
They describe the shape of a relative low across stations. A coherent low may justify follow-up, but the shape alone does not identify groundwater. Repeat measurements, profile geometry, cross-lines and geology are required.
Can the profile map predict exact well yield?+
No. A surface profile can help rank a geological target, but sustainable yield is measured after drilling with a controlled pumping test and recovery monitoring.
Where can I download the PQWT map analysis PDF for free?+
Use the direct download buttons in this guide or open the PQWT Download Center. The English operation guide, English and French profile-analysis guides, and Russian operation guide are available without registration. Follow the exact model manual for controls, electrode layout and firmware-specific steps.
PROJECT REVIEW & MODEL SELECTION
Choosing a groundwater detector for your project?
For a new instrument, tell us your country, survey target, expected depth and quantity. If you already own a device and need map review, use the after-sales form with your model, purchase channel and survey details.
I already own a device: after-sales support