A geophysical water detector does not directly see an underground lake or guarantee a productive well. It records a physical response along a survey line and helps an experienced operator identify zones that may deserve further investigation. A responsible decision combines repeatable profiles, cross-lines, local geology and nearby well records, then confirms the target with drilling logs, water-level measurements and a pumping test.
People searching for a geophysical water detector usually want one clear result: a safer place to drill. The instrument can support that decision, but only when the survey is designed around a geological question and the output is interpreted as indirect evidence rather than proof of water.
This guide explains the complete decision chain—from project preparation and field acquisition to profile review, target ranking and post-drilling verification. It also shows which information to send when comparing PQWT GT, S, TC and mobile groundwater detector configurations.
What does a geophysical water detector actually measure?
A groundwater survey instrument measures a geophysical response at the ground surface. Depending on the method, that response may be related to electrical potential, apparent resistivity, electromagnetic behavior or another physical property of the subsurface. The result is then displayed as curves, sections or profile maps for interpretation.
Groundwater can influence electrical behavior, but it is not the only cause of an anomaly. Clay, salinity, weathered rock, fractures, lithological boundaries, buried utilities and cultural electrical noise can also change the response. The operator must therefore compare the anomaly with the geological setting and with control measurements.
How geophysical groundwater methods differ
No method should be selected from the maximum depth number alone. The useful method is the one that fits the expected aquifer, geological contrast, available survey space, drilling budget and level of uncertainty the project can accept.
| Method | Typical field output | Important limitation |
|---|---|---|
| Natural-field or potential-based screening | Curves and automatically generated profile maps | Interpretation depends strongly on geology, interference control and repeatability |
| Vertical electrical sounding (VES) | Apparent-resistivity response versus electrode spacing | One-dimensional assumptions may not fit complex lateral geology |
| Electrical resistivity tomography (ERT) | Two-dimensional resistivity section | Requires electrode deployment, inversion choices and qualified interpretation |
| Electromagnetic methods | Conductivity or resistivity-related response | Depth and resolution vary with frequency, geometry, terrain and interference |
| Magnetotelluric methods | Natural electromagnetic response over a broad depth range | Acquisition and interpretation can be complex and are not a direct water-yield test |
A repeatable geophysical water detector field workflow
Collect local evidence
Gather geological maps, nearby well depths, water strikes, static levels, yields, failed drilling records, terrain and known utilities.
Define the target question
Decide whether the line is testing a fracture zone, weathered contact, valley structure, lithological boundary or another specific hypothesis.
Design useful survey lines
Where access permits, orient the main line across the suspected structure and leave enough distance for a representative background response.
Control acquisition settings
Keep point spacing, electrode arrangement, direction and measurement procedure consistent so adjacent readings remain comparable.
Repeat suspicious sections
Re-measure the anomaly and nearby background. A target that disappears after a repeat should not control an expensive drilling decision.
Add a cross-line
A crossing profile tests whether the anomaly has spatial continuity and helps separate a structure from one-line noise.
Rank more than one target
Record the preferred point, alternatives, confidence, possible interference and the evidence that supports or weakens each interpretation.
How to review curves and groundwater profile maps
Start with the background
Identify the normal response of the line before focusing on the strongest color or isolated peak.
Check continuity
A geological feature usually has a spatial pattern. One sharp point may be noise, poor contact or a local surface effect.
Look for repeatability
Compare repeated measurements made with the same geometry and settings. Stable features carry more weight.
Test the direction
A second line helps confirm whether the feature extends in a way that makes geological sense.
Challenge the interpretation
Ask whether clay, salinity, topography, power lines, fences, pipes or buildings could explain the same response.
Document uncertainty
A useful report states why a target was chosen, which assumptions were made and what drilling must verify.
Site conditions that can change the result
- Clay-rich layers may produce a conductive response that can resemble water-bearing material.
- Saline groundwater can produce a different electrical contrast from fresh groundwater and may affect water suitability.
- Dry, resistive surface material can reduce contact quality and create unstable measurements.
- Power lines, buried cables, fences, pipelines, pumps and buildings may introduce cultural interference.
- Steep terrain can complicate line design and the relationship between surface position and interpreted depth.
- Closely spaced geological units or very small fractures may be below the practical resolution of the survey geometry.
- Operator consistency, cable condition, electrode contact and repeat checks directly influence data quality.
How to verify a recommended borehole target
| Verification record | What it confirms |
|---|---|
| Drilling log | Actual lithology, weathering, fractures and changes with depth |
| Water-strike record | Depths where inflow or losses were observed during drilling |
| Static water level | Resting water level after the borehole has stabilized |
| Pumping water level | Drawdown under a defined pumping rate |
| Recovery measurements | How quickly the water level recovers after pumping stops |
| Pumping test | A defensible estimate of sustainable yield under stated test conditions |
| Water analysis | Whether water quality is suitable for the intended use |
Which PQWT groundwater detector configuration should you review?
Confirm the current host, cables, electrodes, accessories, training language, warranty and packing list in the formal quotation. A model name or stated range should not substitute for a project-specific configuration check.
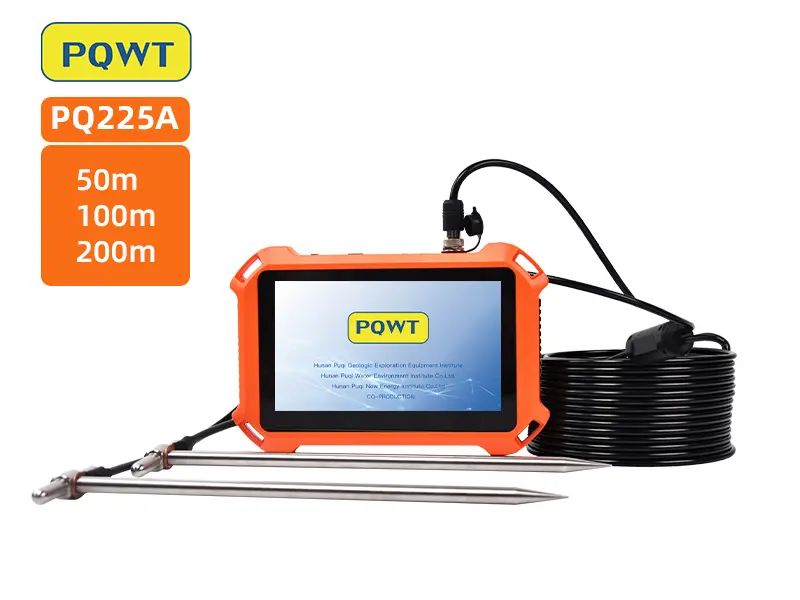
50 / 100 / 200 m stated survey settings
Compare a portable natural-electric-field mapping option against your actual drilling depth and local geology.
View product →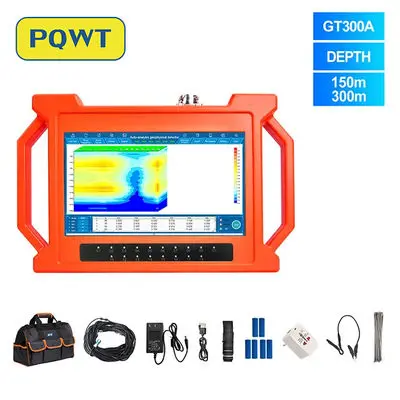
300 m multi-channel configuration
For projects that need dense field acquisition and a practical medium-range drilling plan.
View product →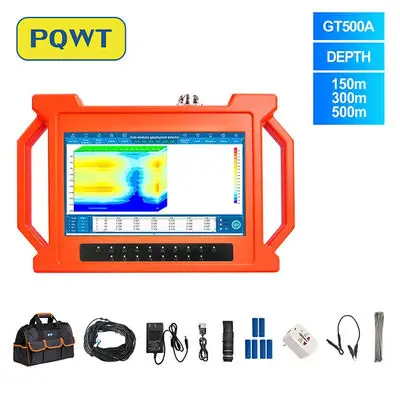
500 m multi-channel configuration
For deeper target screening supported by well records, geological controls and professional interpretation.
View product →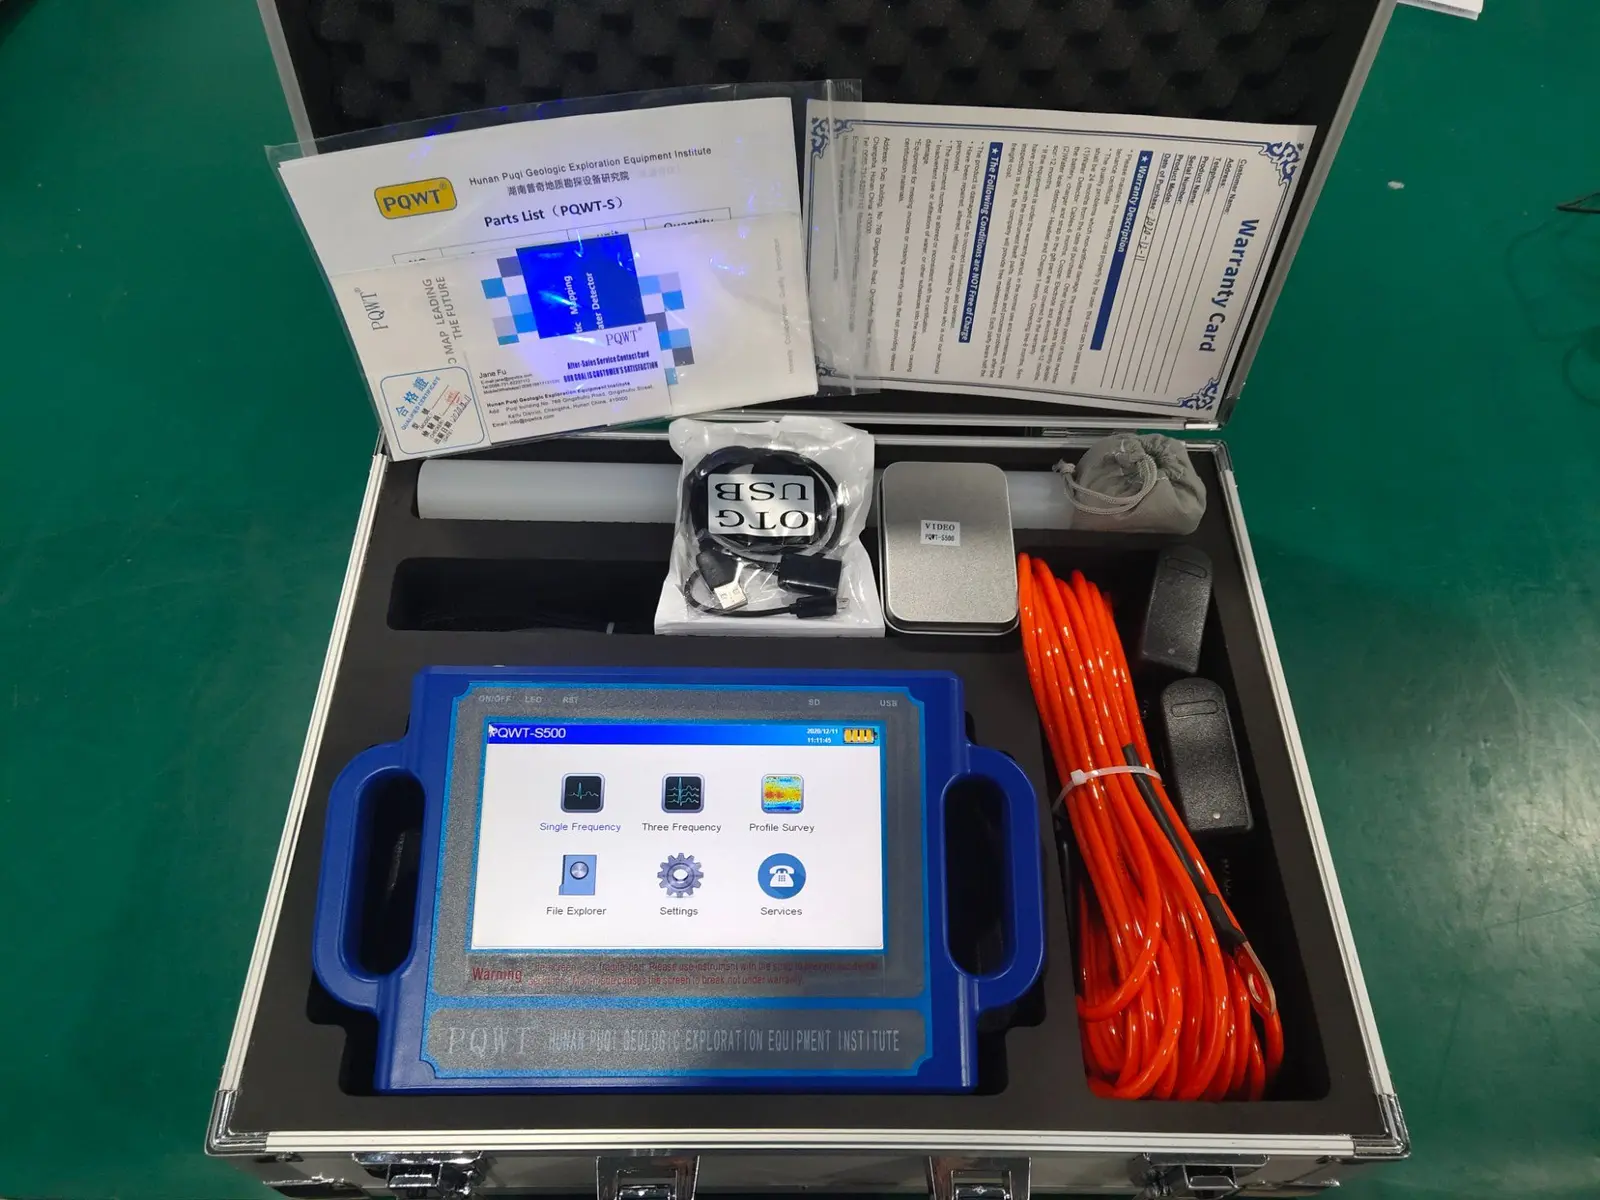
500 m touchscreen workflow
For portable field surveys with integrated curves and automatic profile-map output.
View product →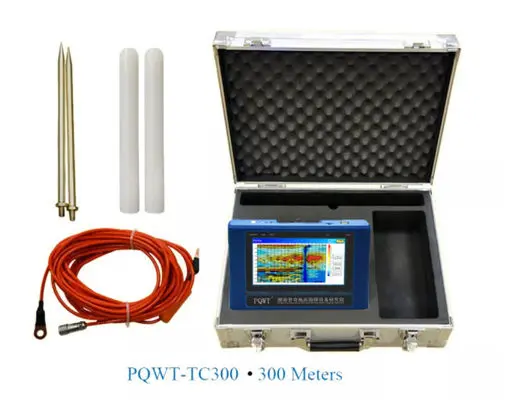
300 m portable mapping configuration
For practical borehole-siting work where compact transport and a guided workflow are priorities.
View product →Send this information for a project-specific recommendation
| Project information | Why it matters |
|---|---|
| Country and exact project area | Provides geological, support and shipping context |
| Target drilling depth | Narrows the practical instrument range |
| Known geology and terrain | Supports line design and interpretation |
| Nearby well depths and yields | Shows what has actually been verified locally |
| Survey area and site access | Determines feasible line length and configuration |
| Rig capacity and borehole budget | Keeps the recommendation within what can be tested |
| Operator experience and language | Defines training and interpretation support |
| Required quantity and destination | Allows the team to confirm packing and export quotation |
Frequently asked questions
Can a geophysical water detector directly see groundwater?+
No. It measures a geophysical response that may be influenced by groundwater and other geological or cultural factors. The operator interprets patterns and ranks targets for verification.
Can a groundwater detector guarantee a successful well?+
No. A survey can reduce uncertainty, but drilling success, water depth, yield and quality must be confirmed through drilling records, water-level measurements, pumping tests and laboratory analysis.
Is the deepest detector always the best choice?+
No. Choose the range from realistic aquifer depth, drilling capacity, geology, survey area and the cost of verifying a target. A much deeper range may add cost without improving the practical decision.
Why should I repeat a survey line?+
Repeat measurements show whether an anomaly is stable. If the pattern changes materially under the same geometry and settings, interference, contact or procedure should be checked before drilling.
What can cause a false groundwater anomaly?+
Clay, salinity, lithological changes, weathering, utilities, power lines, fences, poor electrode contact, terrain and inconsistent acquisition can all affect the response.
Can the profile map predict borehole yield?+
No. A profile can help rank a drilling target, but sustainable yield is established after drilling with a controlled pumping test and recovery measurements.
PROJECT REVIEW & MODEL SELECTION
Choose a geophysical water detector for your project
Send the project location, target depth, geology, nearby well records, survey area and rig capacity. We will compare suitable configurations and confirm the current packing list, training, warranty and export quotation.
I already own a device: after-sales support